Performance Charts
Statistics and charts related to a player's performance may be accessed from the Edit Player Screen (see here) and directly from the scorecard.
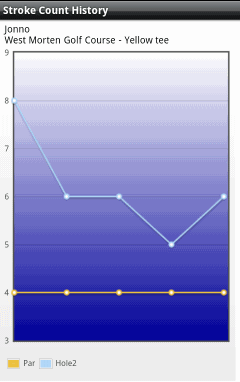
LONG clicking one of the stroke count cells on the scorecard will cause a chart to be displayed. This chart will plot the various stroke counts that have been previously recorded for the selected hole.
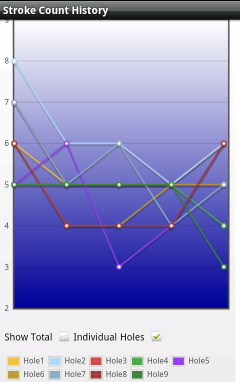
If a total or subtotal cell is selected (In, Out or Total) then the chart will display the recorded counts for the (sub)total and also the individual counts for all the holes that make up the total.
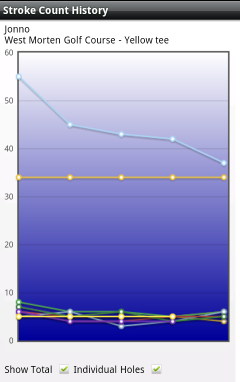
If a combined chart is displayed then toggling the plots for the totals or for the individual holes on and off may make the chart more readable.
Clicking the Chart button on the Edit Player screen will display a screen showing various statistics for the player. These statistics are based off of gross scores (i.e. they do not take account of any handicap strokes received).
The top panel shows the values across all data recorded for the player with no filtering. In the lower panel, the data used to calculate the statistics may be filtered by golf course or time period.
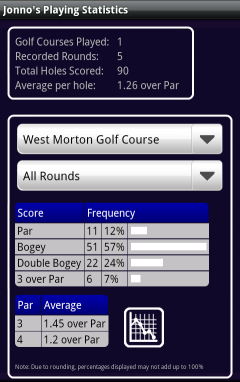
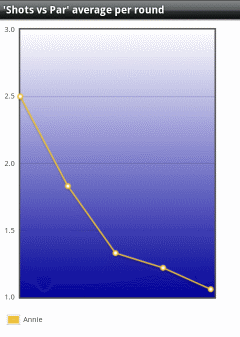
Clicking the Chart button on the above screen will display a chart showing the player's shots over-or-under par (averaged for the round) for each round recorded.